It seems our recent calls that the US market in particular is overvalued and due a correction is now beginning to permeate amongst the wider investing public, particularly when married with the continued withdrawal of monetary stimulus in the States (albeit stable in the UK, likely increasing in Europe and almost certainly new stimulus around the corner in Japan – which we’ll come to below).
It was an “interesting” week with the US rallying on the back of dovish comments from the FED regarding the pace of future interest rate rises with the release of the FOMC minutes on Wednesday before then selling off sharply on Thursday, in fact one of the sharpest intraday reversal moves seen for quite a few months.
We took the opportunity to sell Call options on the S&P 500 right at the peak on Wednesday evening as our proprietary indicators were displaying excessive bullish sentiment. What is interesting to us however is that our sentiment indicator swung around in the subsequent 24 hours (Thurs – Fri) to one of extreme bearishness – a rare phenomenon in over 6 years of concise data that we hold. Regular readers will recall that we find the Put:Call ratio in the States an almost infallible guide to short term bottoms when it prints at a figure (on the equity only measure) around 0.7-0.80. It tells us that the money is hedged or the “bear”, in the short term, is in. Which by default makes the market less susceptible to more falls, and so being a classic contrary indicator.
Put:Call ratio – what is it telling us?
Take a look at the two charts below. The first one is the “Equity only Put:Call ratio” over the last 1 year. We can see 2 elements here – the massive swing over 24 hours from extreme bullishness (0.45 print) to extreme bearishness (0.75) and secondly, the occasions when this ratio has printed around similar levels to the close on Friday.
The 2nd chart is the S&P500 index over the same period. What I have done here is circle the occasions that coincided over the last year with the extreme prints on the Put:Call measure. Notice anything? Such a value braked the markets falls over subsequent days and in fact provided an important intermediate bottom.
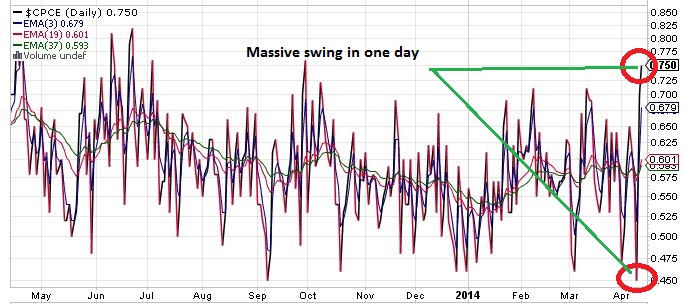
Put Call ratio (Equity only) over 12 months
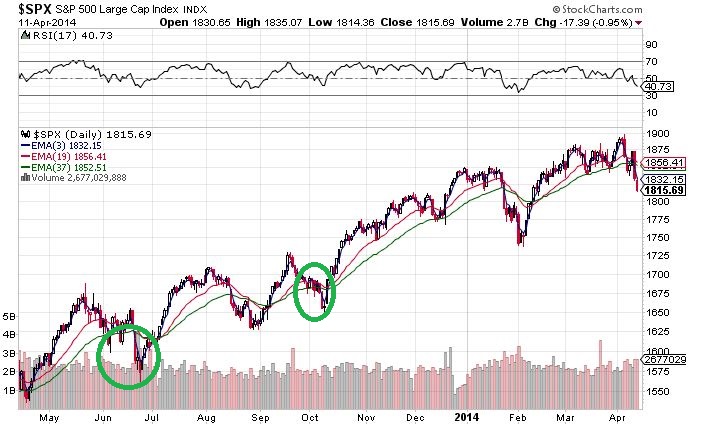
S&P 500 over last year with Put:call extreme measures circled
AAII measures
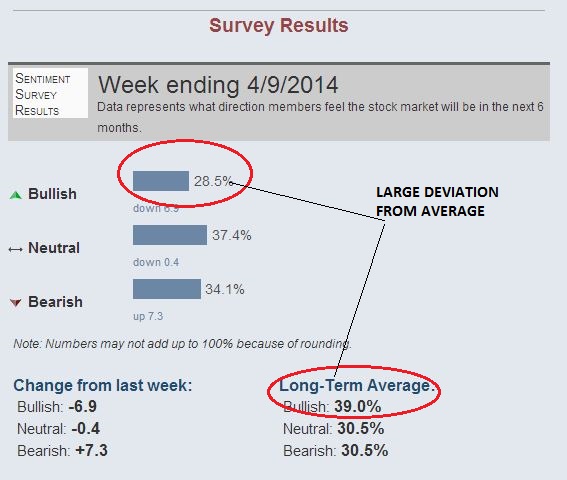
The other measure that caught my eye was the AAII sentiment survey and that also has, at extremes, provided a good steer as to turning points. Below is the sentiment measure up to 9th April. I bring your attention to the deviation of the bullishness measure from its long term average. Bear in mind this survey was taken up to Wednesday of last week. With the violent sell off’s seen across the tech arena in particular in recent days, this will likely only have intensified bear sentiment.
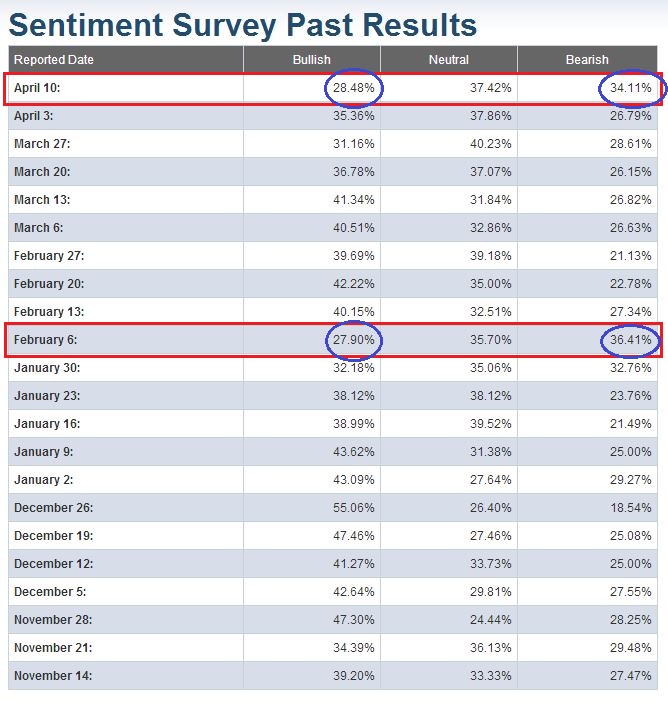
The next table puts the point above in perspective, namely displaying the individual weekly measures from the survey over the last 6 months. Again I have highlighted the salient data. The measure seen on Wednesday was last displayed going into early February of this year.
Now, let’s look at the S&P500 index over the last 3 months, in particular looking for the point that coincided with the AAII measure seen last week. As the chart says, “X” marks the spot! Remember the point above, namely that this sentiment figure was taken before the rout seen on Thursday and Friday.
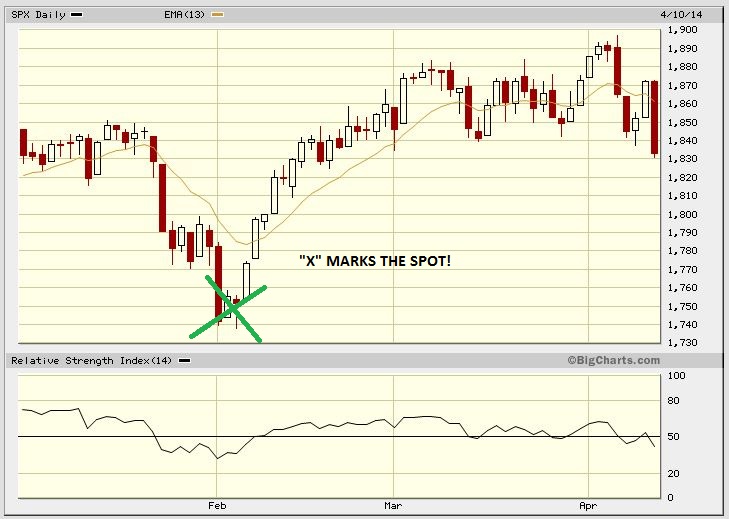
So now we have 2 historically robust data points that are telling us that the likelihood of sharp further falls from here are slim. That is important to pay heed of in our book, and with this in mind we covered our short Calls near the lows on Friday after taking good profits.

I always like to listen to other pundits and participants in the market and I got the distinct impression on Friday that there was quite a bit of fear around with a number of my compatriots not prepared to play the long side or hold positions for longer than a few hours. Universally it seems that they are expecting further shakedowns next week. The VIX measure also illustrates this tick up in fear, rising nearly 40% between Wednesday – Friday. Now, what I have learnt over the years is that FEAR in particular is for buying (“greed” is harder to really find a swing point, certainly in the short term) and NOT selling. Of course the reason it is for buying is that it is very hard to do for most humans where the natural response is to run to safety.
Throw into the mix short term very oversold measures on key technical indicators like the RSI & Stochastics (the 4hr interval RSI is as good a “swing” indicator as any) with these also at points that typically coincide with, at least in the short term, sharp rebounds of 1-2%, and the ingredients for a rally that catches out the consensus are largely in the baking tray.
All this being said, we would be mad not to pay heed of what the chart of many of the major indices are showing us – namely head and shoulder breakdowns. See below both the Nikkei and the S&P 500 charts. The S&P 500 looks to have decisively broken its neck line, while the Nikkei – the chart being over a longer timescale and so a more elongated formation well, the jury is out here whether the neckline has been broken. Interesting statistic – head and shoulder formations generally play out only around 50% of the time. We highly suspect that on this occasion, certainly in Japan, that this is a bear trap that will prove to be a false break.
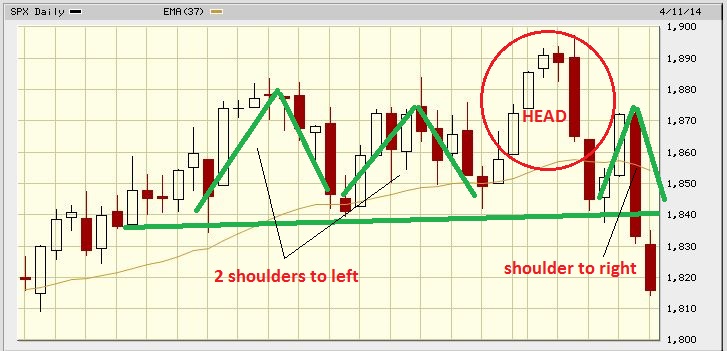
S&P 500 chart
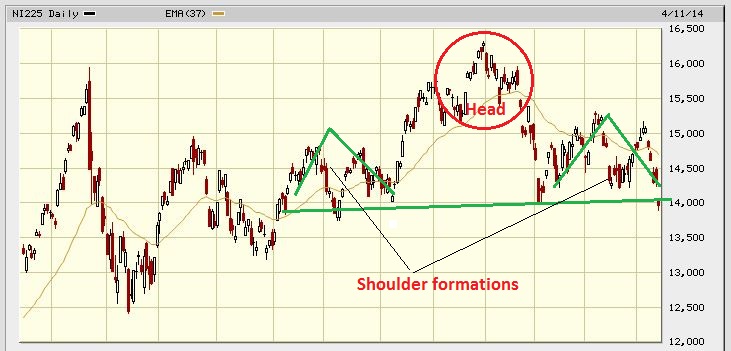
Nikkei 225 chart
Are we wrong on Japan?
Only last week we produced a blog on gold and Japan with the gold side playing out nicely for us but the Japanese side inflicting some pain (see here – https://www.spreadbetmagazine.com/blog/titan-abenomics-unintended-consequences-the-japanese-equity.html). We signed off with – “Either way, the chart of the Nikkei above is not, in our long experience, one that looks like it is going lower.” Egg and face spring to mind with the Nikkei shedding over 1000 points last week. One thing we are not afraid to do here is highlight that we do not get it right all the time.
However, the basis of the article stands just as much today. The only difference being that the index is some 8% lower now. From peak to trough last year when we called the top in the Japanese market (see here – https://www.spreadbetmagazine.com/blog/sbm-v-john-piper-evil-knievil-its-time-for-a-tactical-short.html), the index has shed just over 14%.
If we take the late December poke to a modest new high as the peak then we are now just under 4 months into this correction. If we take the “top” of the recent bull run fromearly May last year then, notwithstanding the magnitude of the gains with an almost doubling of prices over the period from end May 2012 – end May 2013, this will have been one of the shortest major market bull runs on record. Additionally, the 14% retracement seen thus far is not sufficient to qualify for the description of a bear market (being 20%) unlike many US tech names that are down 20,30 or even 40+%, in particular the biotech sector. Our contention is that this recent pull back in Japan is a typical bull market pause and it will not be long before it marches on to new highs this year.
We are also emboldened in our belief that Japan offers up a renewed buying opportunity with the contents of our blog of last week where we highlighted foreign net buying slumping to multi-year lows. Remember the “masses” are always wrong at extremes (particularly the so called “experts”). To put last week’s falls into perspective, it is almost on a par with the rout seen in the aftermath of the tsunami in 2011.
From a fundamental perspective the Nikkei presently trades at around 13 times earnings – the cheapest of all the major markets and has a very attractive price:book ratio of just over 1.3 times. Even though the Japanese central bank did not add to its monetary easing measures last week, with the introduction of the increased sales tax already having an effect on confidence again, we expect the “Abenomics” experiment to provide another policy jolt with more QE over coming months, possibly at the meeting at the end of this month.
If outsized investment returns come from buying when others are selling, buying into attractive fundamental value and trying to time poor sentiment as an opportune time to take a position (the advance decline measure in Japan ended at an extreme bearish level last week, possibly indicating that selling is exhausted and a sharp rebound is imminent), we would argue one can hardly find a better proposition in global markets today than Japan (certain emerging markets excepted as we relay on page 34 in the latest edition of our magazine here – http://issuu.com/spreadbetmagazine/docs/spreadbet_magazine_v27_generic).
With the above in mind we are staying the course on our Japanese exposure.
Titan returns since inception on 1 July 2013 (gross, performance fee not deducted)
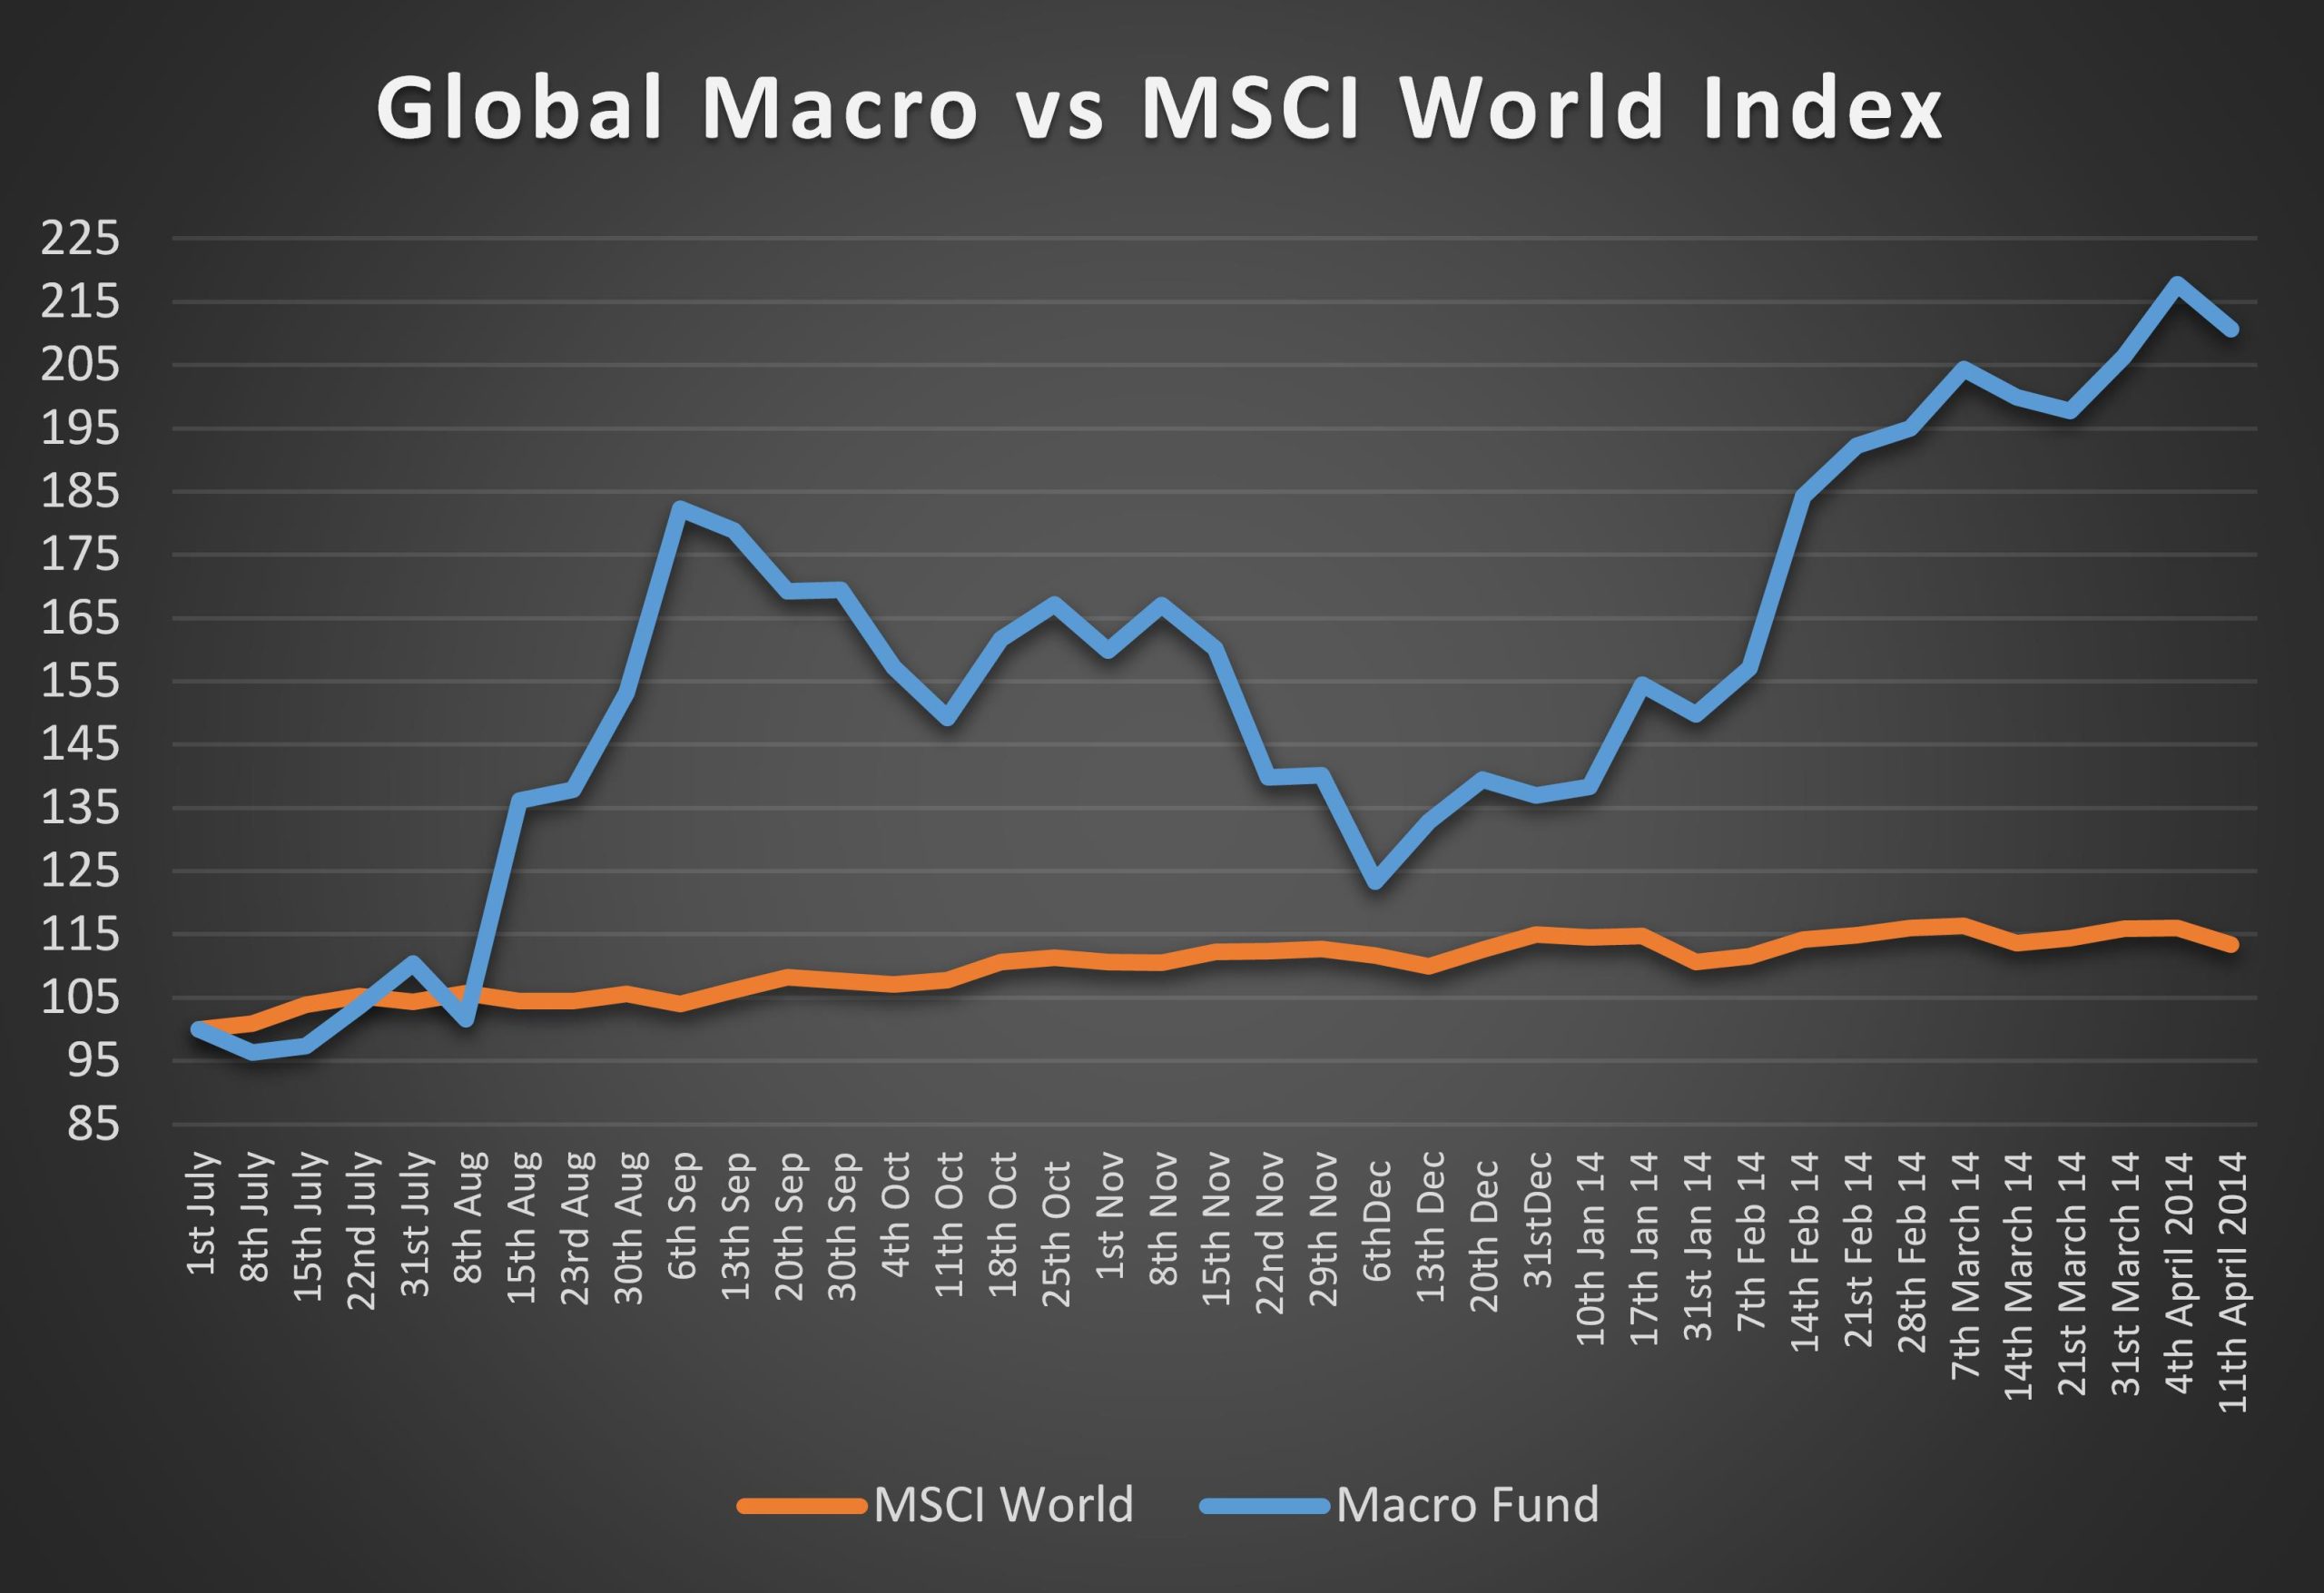
Past performance is not necessarily a guide to future performance.

