
Below is an interesting prediction and very wise words from noted market bull Jeff Saut who, in an interview with Eric King of King World News, stated that:
“For the past two and a half months I have targeted tomorrow, July 19th, as the intermediate-top on both my quantitative timing and technical models. So I think tomorrow is the potential turning point for the first meaningful decline of the year. I have been raising cash for the past few weeks and I think this correction in the stock market will be roughly 10% to 12%.
It’s just a question of, is this thing going to end with a whimper, or is it going to end with a bang? The shorts have been absolutely destroyed here. We could see a blue-heat move that carries the S&P 500 somewhere between 1,700 and 1,730. That would be the ideal pattern, but they don’t operate the market for my benefit so you have to take what they give you.
I don’t think anybody can time the market on a consistent basis, but if you listen to the message of the stock market you sure as heck can decide when you should be ‘playing hard’ and when you should not be playing as hard, and so I’m not playing that hard right here.”
Whether or not Jeff is right about the exact date of the market top, it does bring attention to the recent correction and subsequent rally to new highs (something we predicted almost exactly to the day, see here – https://www.spreadbetmagazine.com/blog/a-reminder-of-our-call-of-thurs-20-june-against-consensus.html). Was that correction just a pullback in an ongoing upward bullish trend or is the beginning of a more major topping process much as we saw in 2007? The chart below shows the eerily similar rice action of the market from 2003-2008 as compared to 2009 top.
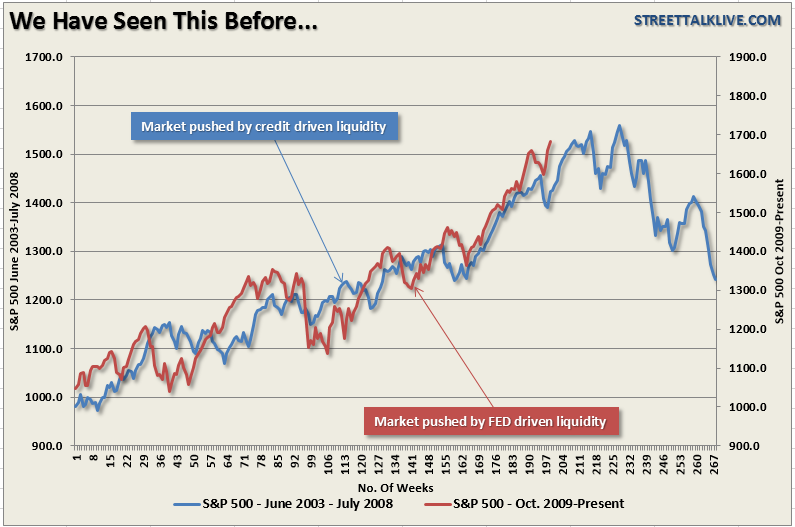
The interesting thing about the historical price action is the potential timing of the Federal Reserve’s “tapering” of the current bond buying scheme. The market advance prior to 2008 was driven by excess liquidity derived from the credit boom cycle whereas the current advance has been driven almost entirely by the liquidity pushed into the system by the Federal Reserve. The extraction of that liquidity could well mark the top of the current cyclical bull advance later this year or in early 2014.
It is not just price patterns that have me concerned, but rather other similarities between these two advances that should be noted as well.
Leverage
The next chart below is the amount of leverage in the financial system as measured by the level of margin debt. Margin debt has currently risen to an all-time high during the current liquidity cycle much the same as was witnessed prior to the financial crisis. That is a pretty compelling pattern relating to market tops I’m sure you agree?
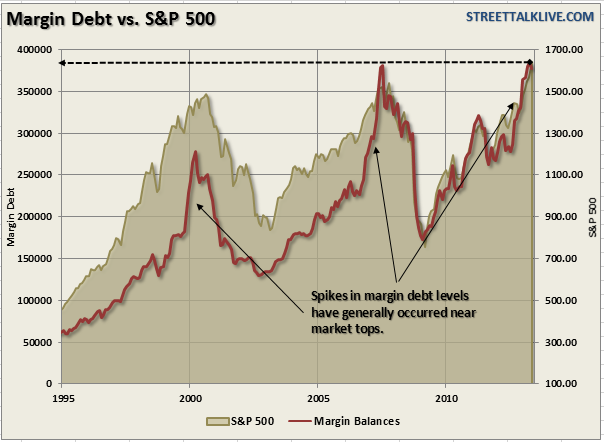
As you can see spikes in margin debt, as market exuberance begins to form, generally takes place near market peaks. The current spike in margin debt to record levels is a potential warning sign we would be silly not to pay heed of.
Valuations
Market valuations have also been expanding over the last couple of quarters as prices have been artificially inflated while earnings growth has deteriorated. The result has been a push of market valuations, as measured by P/E ratios, to levels in excess of those witnessed at the prior market peak (1999/2000 excluded). The chart below shows reported trailing twelve month price-earnings ratios for the seven quarters leading up to the peak in earnings.
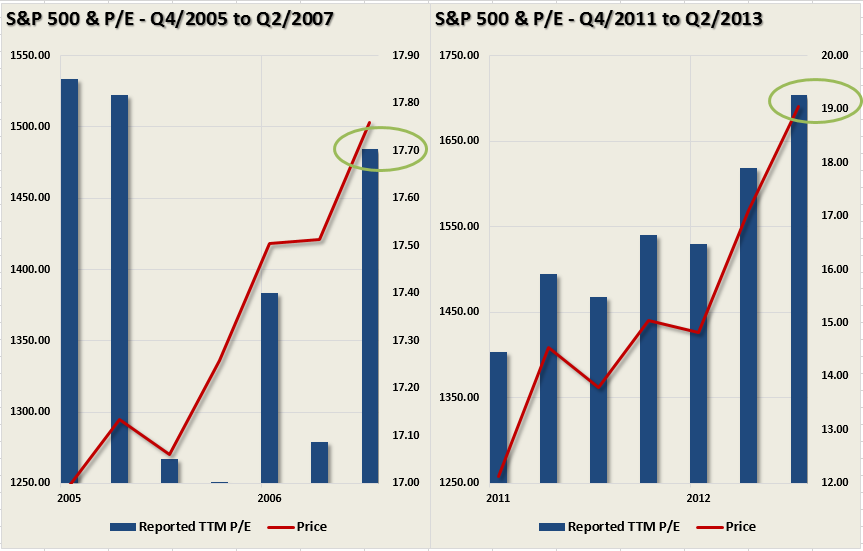

While valuation measures are historically horrible market timing devices, especially when the market is being pushed by liquidity, they do give some insight as to extremes. In the previous peak in reported earnings in 2007, they fell sharply to a low of just $6.86 per share by March of 2009 and this is illustrative of just how earnings do not go on a one way trajectory and that relying on an earnings based valuation to justify a markets levels is the worst possible basis.
Of course, at the peak in 2007, the economy was growing, there was no threat of recession, housing related issues were“contained” and Bernanke calmly explained that we were in a “goldilocks economy.” (true!). Just six months later, the economy was in a recession and the financial crisis had set upon us. While I am not saying that the same thing is about to happen – what does concern me is the extreme amount of confidence that currently exists that we have once again entered into that same “goldilocks” state.
Earnings
Of course, you cannot really discuss P/E ratios without discussing the trend and trajectory of earnings. Reported earnings were steadily rising as we entered into the peak of valuations in 2007. At that time, the belief was that market prices would continue to rise along with earnings. The problem was that belief was quickly shattered as the initial waves of the recession began to set in. Currently, that same belief is once again largely prevalent. The chart below shows the historical trend of reported trailing twelve months earnings per share versus the stock market. The disjoint in recent months is very clear.
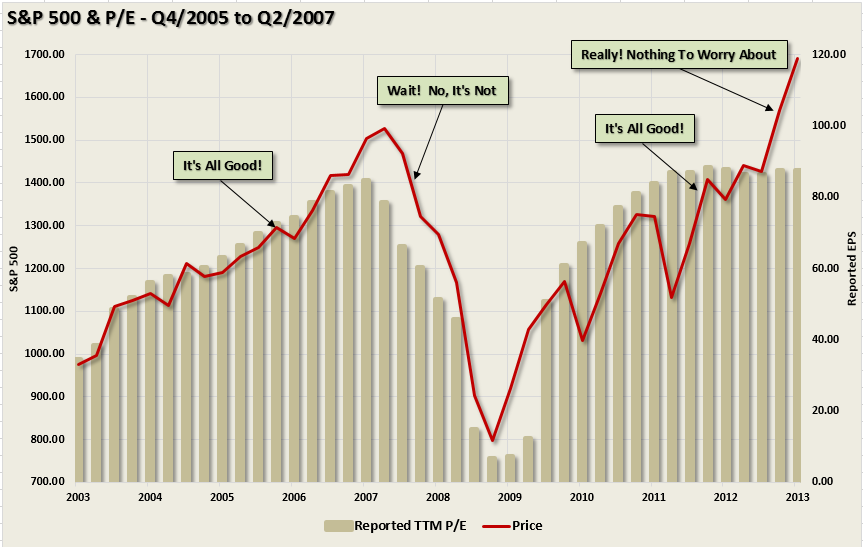
Despite the fact that earnings have been stagnating for several quarters now; the belief is that at just any moment the economy will kick into gear and earnings will play catchup with rapidly rising valuations. This has historically been a losing proposition. Valuation excesses tend to be mean reverting through a fall in the numerator rather than a rise in the denominator.
Economic Growth
Looking at earnings, valuations and price are all important to whether or not we are currently near a peak in the financial markets. However, ultimately, it is the economy that will drive all of these issues in the future. The chart below shows annualized growth rates of quarterly real GDP for the periods of 2004 through 2007 and 2009 to present.
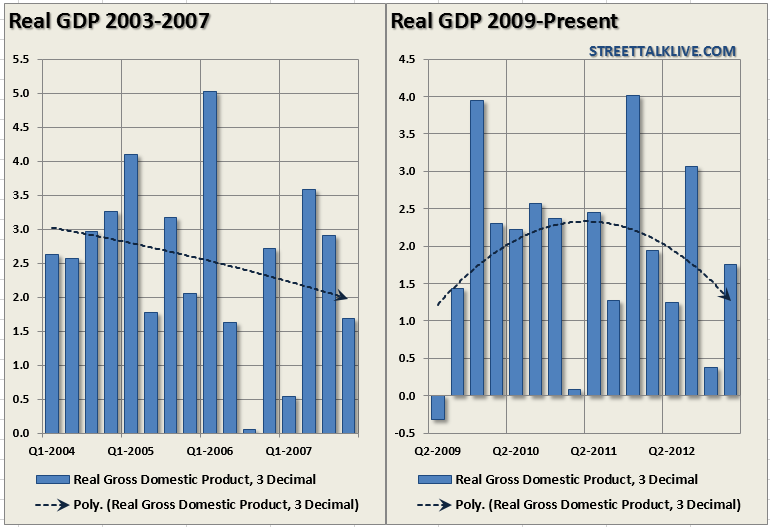
The importance here is that in both cases, the actual rate of economic growth peaked near the middle of the economic cycle and then began to wane. The polynomial trend lines shows this a little more clearly. Of course, as stated above, despite clear evidence that the economy was beginning to struggle, the inherent belief by most mainstream analysts and economists was that the “soft patch” would quickly recover. Unfortunately, that was not the case. The impact of the recession in the Eurozone, and the slowdown in China, is clearly impacting corporate earnings and revenue which puts the current market at risk.
Is This A Market Top?
Are we likely forming a market top? It is very possible. We saw the same type of market action towards the last two market peaks. However, it will only be known for sure in hindsight. The many similarities between the last cyclical bull market cycle and what we are currently experiencing should be at least raising some warning flags for investors. The levels of speculation, leverage, price extensions, duration of the rally, earnings trends and valuations are all at levels that have historically led to not so pleasant outcomes.
John Hussman summed it up well recently when he stated:
“Given the present evidence, however, my real concern is that much like the rolling tops of 2000 and 2007, each pleasant breeze here lulls investors into complacency – but in the face of overvalued, overbought, over bullish conditions that, from a cyclical and secular standpoint, should probably have them wide-eyed with terror. We can’t rule out that the bough will sway for a while longer despite the weight, but we won’t embrace the situation by putting our own baby on the twigs. It’s quite crowded up there already.”
Richard Jennings, CFA. Fund Manager Titan Investment Partners