

Richard Jennings, CFA and Chief Fund Manager
One undeniable truth about stocks, bonds, options, and almost everything else that has a value attached to it, is that when “price” becomes sufficiently low enough and detached from those instruments real value, then there is only one direction for prices to follow, and that is north.

David Tepper of Appaloosa Management
While low prices may be the result of ugly prospects, they’re often also the result of investor overreaction, leaving a window of opportunity open for value investors. This is the primary modus operandi of investment for one David Tepper, the founder of Appaloosa Management and who will be featured in the next edition of our thismagazine (make sure you are a subscriber to receive it).
This value based method is also the basis for many other asset managers, including us here at Titan Investment Partners. Instead of following the crowd, so-called contrarians seek out unloved assets when they are most undervalued. Ditto they also take care to get rid of those high flying stocks trading on ‘growth’ valuations before the crowd realises how foolish it is to continue backing them (for example we were short sellers of Facebook and NFLX via options at the start of the year while vol was high on these and booked good profits). Some hedge fund managers, in certain instances, look to go short of these overvalued plays although this in itself can be a very difficult job as these “momo” stocks generally go much further than you think.
While value (or lack thereof) doesn’t necessarily mean very low or very high prices, in most situations it pays to read between the lines. We should as investors question extreme values, particularly when the fundamentals behind them do not justify price. Look, for example, at current volatility levels.
The so called “fear” gauge, or simply VIX (a measure of expected volatility in the S&P 500 index – the global benchmark – and being derived from S&P option prices) as it is also known, is just a tad above its 7-year low. This, at a time when the U.S economy faces many challenges in terms of employment and growth, international political issues that are becoming increasingly destabilised, and the EU which faces opposition from a nascent anti-European movement. Investors, possibly momentarily distracted by the World Cup, may simply be ignoring those challenges. But what goes up typically also goes down (and vice versa), and if good vibrations and heady sentiment can help people ignore the warning signs temporarily, past history shows us that it doesn’t take much for the situation to reverse. And quickly.
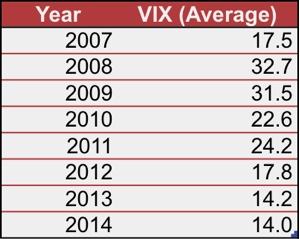
With a little help from our friends at the Federal Reserve, we can see that the VIX has stabilised after the shock suffered during the financial crisis which started with the Lehman collapse in 2008 when the VIX rose to a new record of near 90 – a level that seems incredible today. Continued central bank intervention – first to address liquidity fears and then to stimulate the economy – has contributed to the apparent elimination of downside risks and allowed the VIX to decrease substantially and steadily over the last 6 years. This is all well and good, but the truth is that the lack of volatility isn’t pari passu with fundamentals. As we have already mentioned, the challenges are far too large for investors to continue to ignore and the stock market is, on almost every measure imaginable currently overvalued, on some levels dramatically so, with the only prior precedent the era at the turn of the millennium and the infamous dotcom bubble.
Take a look at a few charts below:
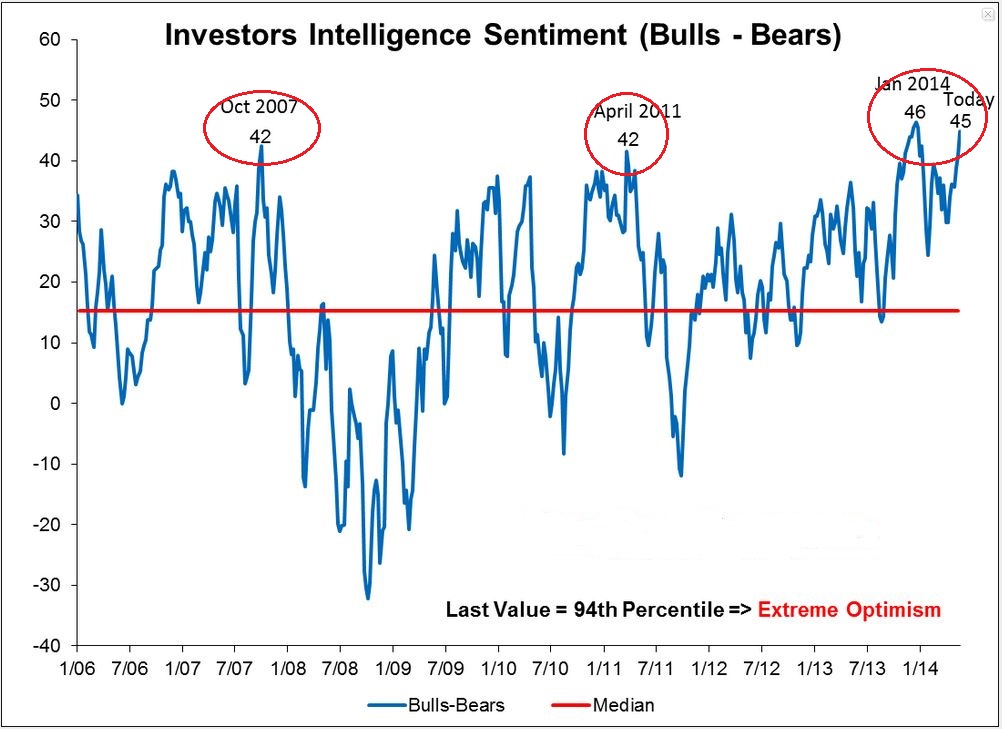
Notice anything about the prior periods when such excessively bullish sentiment hit extremes? That’s right, it was just before major lurches lower in the market as the chart below reveals…
 S&P 500 over last 8 years
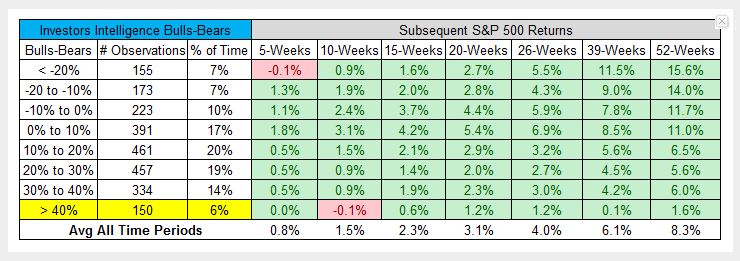
This table shows us expected returns for various measures in the II sentiment over a succession of timescales. Not particularly hopeful for the bulls…

Here’s another interesting chart – that of the relative cheapness and dearness of stocks v bonds (a higher number being expensive and vice versa with a lower one). Pretty unequivocal message from here to me…

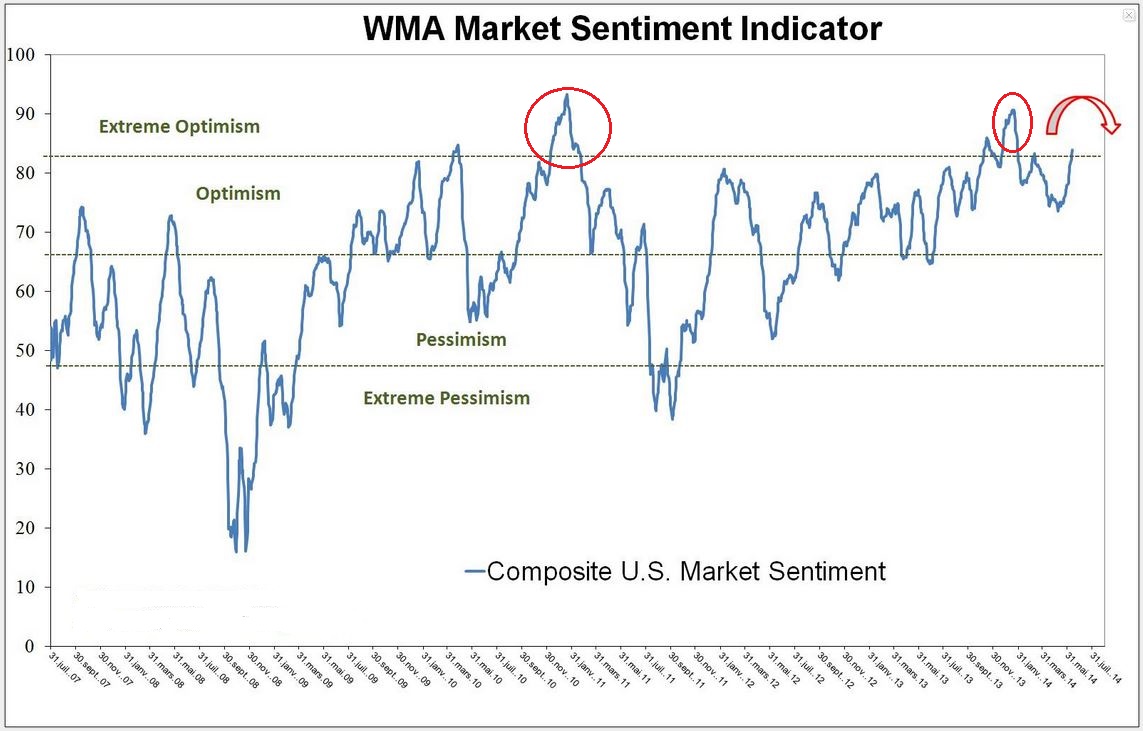
Finally, here’s a market sentiment indicator that looks to be rolling over from extreme optimism.
Current levels of uncertainty should have prevented investors from having stock weightings in excess of 60%, a level that comes from the 60-40 traditional view on the optimal stock-bond portfolio. However, the continuing preference for stocks is clearly a consequence of near zero interest rates and the belief that being out of the equity market, or holding 40% in bonds, is more or less the same as putting the money under the mattress, with 90% safety but 0% income.
The past however tells us that things turn ugly on a hairpin. Particularly more so when all appears calm. Rather like now…
While the VIX has been trending down in the bigger scheme, it has not been a road without bumps. Just look at August 2011 for example. In a matter of days, the VIX shot up on renewed Euro implosion fears and sent investors scurrying for cover as fear reared its ugly head again. Before that in May 2010 there was the infamous Flash Crash – the VIX index rose dramatically here too. Out of nowhere, “someone” started selling whatever they could by way of U.S index futures and exacerbated by trend following systems and stop losses, a crescendo of selling occurred that pushed the Dow 1,000 points down in a few minutes. That’s right, 1000 points in a few minutes. Take it from us, sh*t happens in the markets. Then in August 2011, rating agency S&P decided to review the credit rating of the U.S. which turned August into a nightmare and boosted the VIX to very high levels once again. Lesson – planes can come out blue skies and hit buildings…


The somewhat foxy Ms Doolittle!
In addition to the fundamentals, it seems that there are also many technical reasons why we shouldn’t trust the current level for VIX. According to Abigail Doolittle, founder of Peak Theories Research, the VIX looks to be tracing out what is called “falling wedge” pattern that typically break to the upside and which looks very similar to the movements that preceded upward spikes in the VIX index in the past.
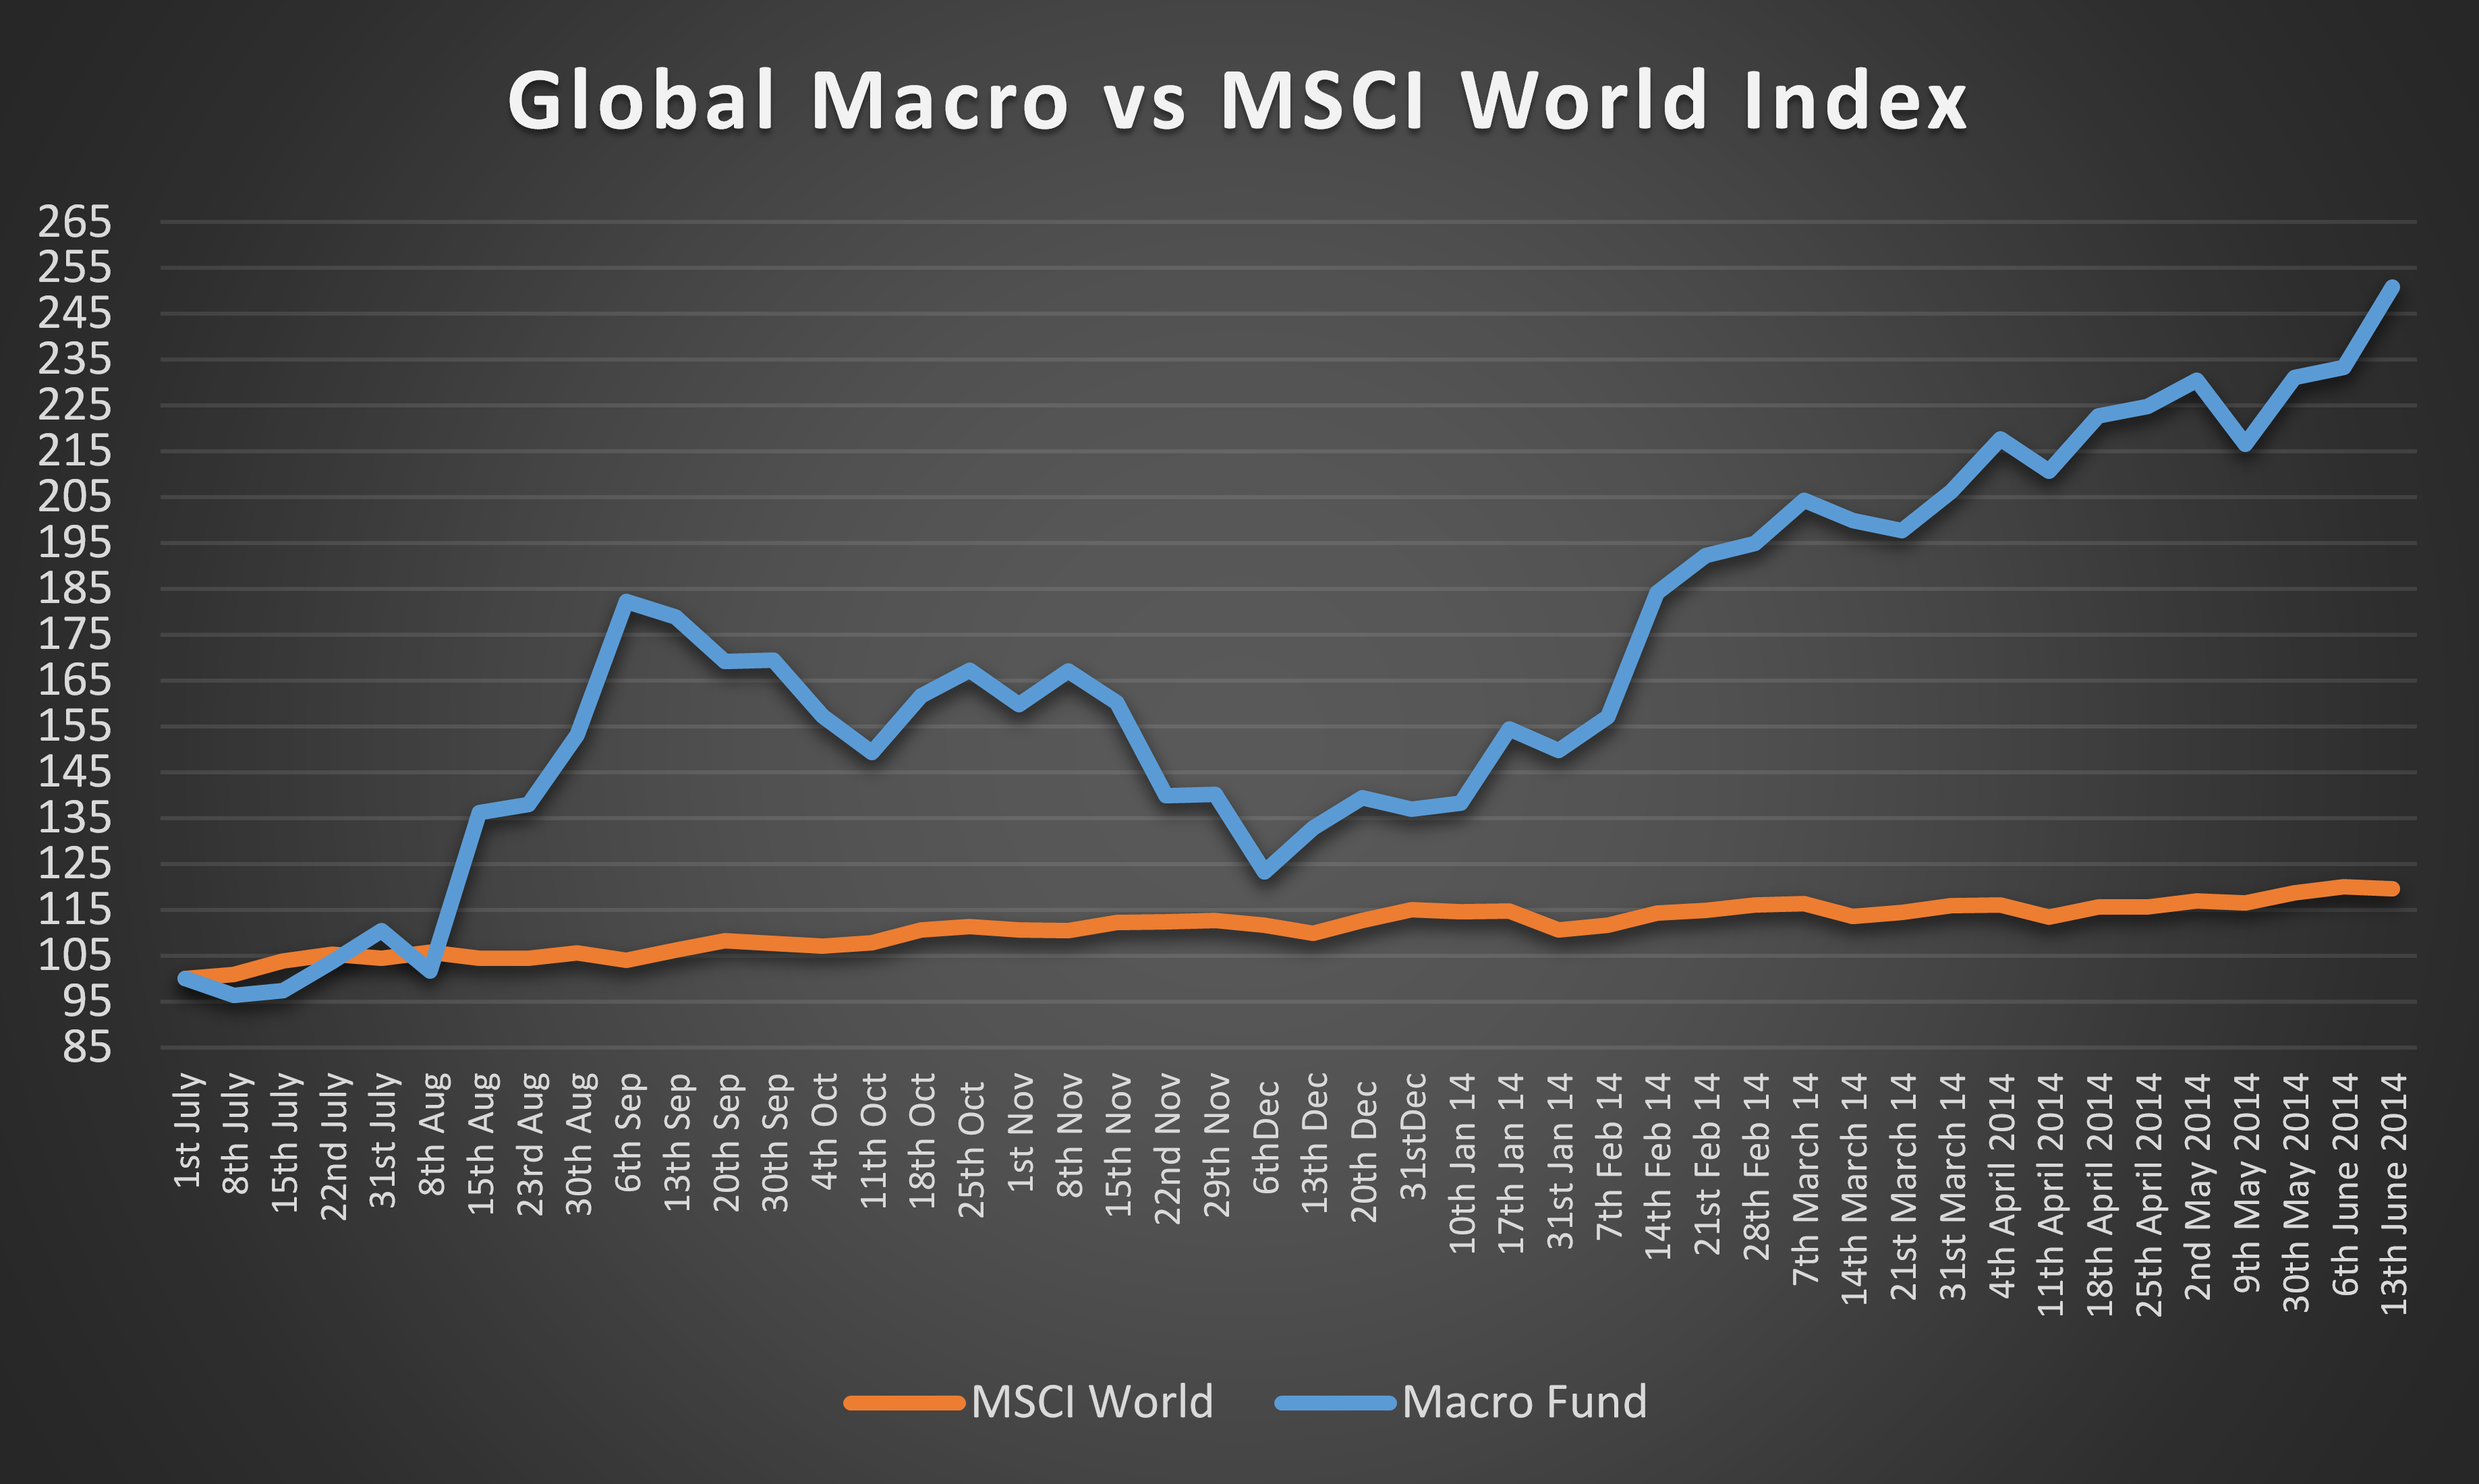
Combining fundamental and technical signals, and noting the upcoming holiday season in the States, we think this may be one of the last opportunities to book profits in the market and position for a sell off. That is precisely what we have been doing in our funds this week, in particular with our Global Macro account which has powered towards a near doubling in value since the beginning of the year. In contrast, most hedge funds and other absolute return offerinfs have struggled to gain any traction at all this year and even break double figures.
Past performance is not necessarily a guarantee of future performance. Returns are gross before the application of our performance fee.